基本自编码器
import tensorflow as tf import matplotlib.pyplot as plt
查看Tensorflow版本
1 | tf.__version__ |
加载数据集
1 | (x_train,_),(x_test,_) = tf.keras.datasets.mnist.load_data() |
扁平化
1 | x_train = x_train.reshape(x_train.shape[0],-1)#-1 表示自动计算 |
2
3
((60000, 28, 28), (10000, 28, 28))
((60000, 784), (10000, 784))
归一化
1 | x_train = tf.cast(x_train,tf.float32)/255 |
设置输入、输出、压缩大小
1 | input_size = 784 |
模型结构
1 | input = tf.keras.layers.Input(shape=(input_size,)) |
1 | model.summary() |
绘制模型
1 | tf.keras.utils.plot_model(model,show_shapes=True)#可视化 |
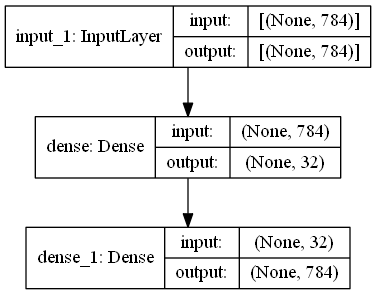
模型配置
1 | model.compile(optimizer='adam', |
模型训练
1 | model.fit(x_train,x_train, |
模型使用
编码
1 | encode = tf.keras.Model(inputs=input,outputs=en) |
解码
1 | input_de = tf.keras.layers.Input(shape=(hidden_size,)) |
1 | encode_test = encode(x_test) |
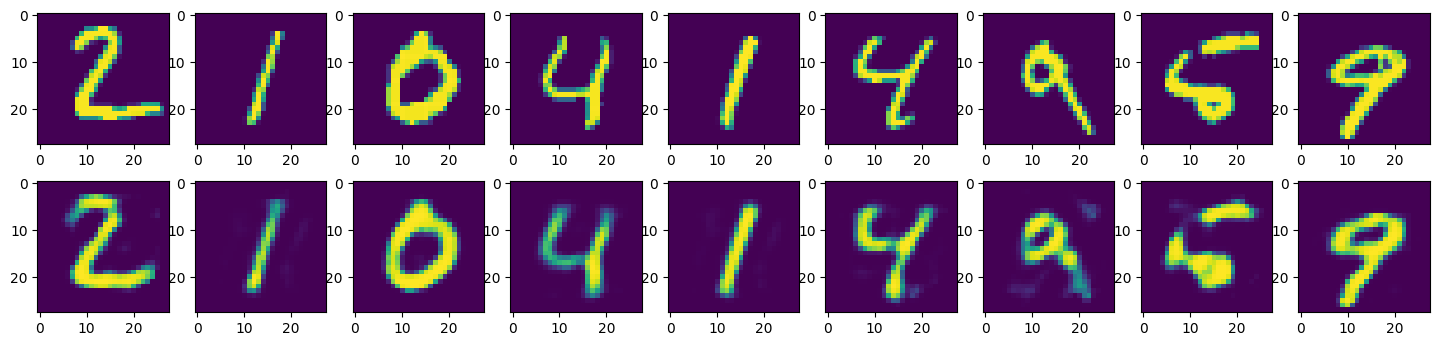
打印原图片与预测图片
设置打印图片张数
1 | n = 10 |
转换数据
1 | x_test = x_test.numpy() |
打印
1 | plt.figure(figsize=(20,4)) |
https://blog.yukifuhane.cn.eu.org/2023/07/14/%E5%9F%BA%E6%9C%AC%E8%87%AA%E7%BC%96%E7%A0%81%E5%99%A8/
本博客所有文章除特别声明外,均采用 CC BY-NC-SA 4.0 许可协议。转载请注明来源 YuKiFuHaNeの博客!
相关推荐

2023-07-14
卷积去噪自编码器的实现
import tensorflow as tf import matplotlib.pyplot as plt import numpy as np 查看tensorflow版本1tf.__version__ 导入mnist数据集1(x_train,_),(x_test,_) = tf.keras.datasets.mnist.load_data() 查看数据维度1x_train.shape,x_test.shape 对数据最后一个维度进行扩展12x_train = np.expand_dims(x_train, -1)x_test = np.expand_dims(x_test, -1) x_train.shape,x_test.shape 1((60000, 28, 28, 1), (10000, 28, 28, 1)) 数据归一化12x_train = tf.cast(x_train,tf.float32)/255x_test = tf.cast(x_test,tf.float32)/255 噪声的添加123factor = 0.5 #增加噪声多少x_train...

2023-07-14
变分自编码器
import tensorflow as tf import numpy as np import matplotlib.pyplot as plt %matplotlib inline 加载手写数据集1(train_image,_),_ = tf.keras.datasets.mnist.load_data() 模型架构1.编码器 -> u,var 2.u,var -> 隐含变量 3.隐含变量 -> 重构图像 数据归一化1train_image = train_image/255 数据shape12train_image.shape(60000, 28, 28) 数据扁平化1train_image = train_image.reshape(-1,28*28)#扁平化 数据shape12train_image.shape(60000, 784) 转换数据类型1train_image = train_image.astype(np.float32)#转换类型 创建dataset1dataset = tf.data.Dataset.from_ten...

2023-07-14
基本去噪自编码器的实现
import tensorflow as tf import matplotlib.pyplot as plt import numpy as np 查看tensorflow版本1tf.__version__ 导入mnist数据集1(x_train,_),(x_test,_) = tf.keras.datasets.mnist.load_data() 查看数据维度1x_train.shape,x_test.shape 对数据进行reshape 28*28->78412x_train = x_train.reshape(x_train.shape[0], -1)x_test = x_test.reshape(x_test.shape[0], -1) 数据归一化12x_train = tf.cast(x_train,tf.float32)/255x_test = tf.cast(x_test,tf.float32)/255 噪声的添加123factor = 0.5 #增加噪声多少x_train_noise = x_train + factor*np.random.n...

2023-07-14
VGG 网络
VGG

2023-07-14
GAN
GAN的设计 生成器的损失由判别器输出来计算的,而判别器输出的是一个概率值,可以通过交叉熵计算 什么是GAN生成式对抗网络(GAN, Generative Adversarial Networks )是一种深度学习模型,是近年来复杂分 布上无监督学习最具前景的方法之一 机器学习的模型可大体分为两类,生成模型( Generative Model)和判别模型(Discriminative Model)。判别模型需要输入变量 ,通过某种模型来 预测 。生成模型是给定某种隐含信息,来随机产生观 测数据 GAN原理GAN 主要包括了两个部分,即生成器 generator 与 判别器 discriminator。==生成器主要用来学习真实图像 分布从而让自身生成的图像更加真实,以骗过判别器 。判别器则需要对接收的图片进行真假判别。== 在训练过程中,生成器努力地让生成的图像更加真实 ,而判别器则努力地去识别出图像的真假,这个过程 相当于一个二人博弈,随着时间的推移,生成器和判 别器在不断地进行对抗。 最终两个网络达到了一个动态均衡:生成器生成...
2023-07-14
自编码器与变分自编码器概念
(1)自动编码器是数据相关的,这意味着自动编码器只能压缩那些与训练数据类似的数据。(2)自动编码器是有损的,与无损压缩算法不同。(3)自动编码器是从数据样本中自动学习的 自编码器应用 数据去噪 降维 图像生成 变分自编码器(VAE)变分自编码器(VariationalAuto-Encoders,VAE)作为深度生成模型的一种形式,是于2014年提出的生成式网络结构。它以概率的方式描述对潜在空间的观察,在数据生成方面表现出了巨大的应用价值。 变分编码器可以随机生成隐含变量提高网络的泛化能力,比普通的自动编码器要好 缺点就是生成的图片会有点模糊