卷积去噪自编码器的实现
import tensorflow as tf import matplotlib.pyplot as plt import numpy as np
查看tensorflow版本
1 | tf.__version__ |
导入mnist数据集
1 | (x_train,_),(x_test,_) = tf.keras.datasets.mnist.load_data() |
查看数据维度
1 | x_train.shape,x_test.shape |
对数据最后一个维度进行扩展
1 | x_train = np.expand_dims(x_train, -1) |
x_train.shape,x_test.shape
数据归一化
1 | x_train = tf.cast(x_train,tf.float32)/255 |
噪声的添加
1 | factor = 0.5 #增加噪声多少 |
数据范围规定
1 | x_train_noise = np.clip(x_train_noise,0.,1.)#加噪后数值可能会不在0~1之间将范围规定到之中,大于1变成1小于0变成00 |
查看加噪后的图片
1 | n=10 |

构建模型
1 | input = tf.keras.layers.Input(shape=(28, 28, 1)) |
查看模型数据流动
1 | tf.keras.utils.plot_model(model,show_shapes=True)#可视化 |
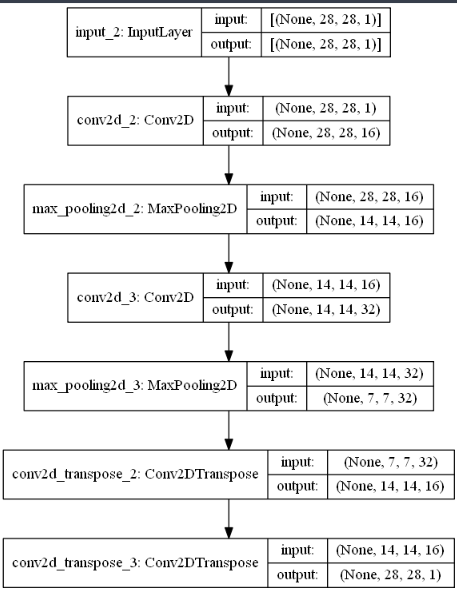
模型配置
1 | model.compile(optimizer='adam', loss='mse') |
模型训练
1 | model.fit(x_train_noisy, x_train, |
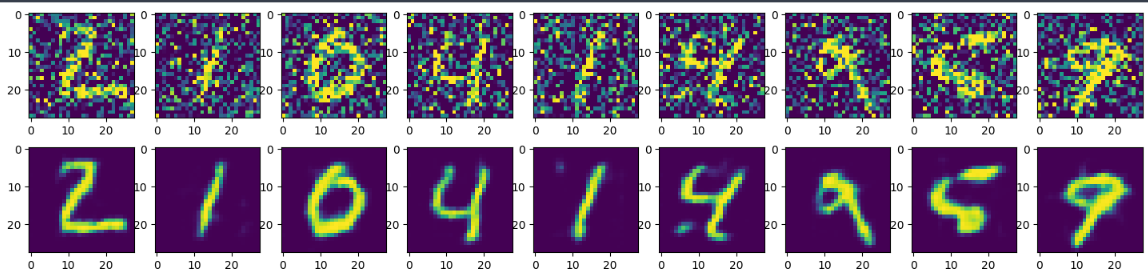
模型测试
1 | pre_test = model.predict(x_test_noisy) |
本博客所有文章除特别声明外,均采用 CC BY-NC-SA 4.0 许可协议。转载请注明来源 YuKiFuHaNeの博客!
相关推荐

2023-07-14
基本去噪自编码器的实现
import tensorflow as tf import matplotlib.pyplot as plt import numpy as np 查看tensorflow版本1tf.__version__ 导入mnist数据集1(x_train,_),(x_test,_) = tf.keras.datasets.mnist.load_data() 查看数据维度1x_train.shape,x_test.shape 对数据进行reshape 28*28->78412x_train = x_train.reshape(x_train.shape[0], -1)x_test = x_test.reshape(x_test.shape[0], -1) 数据归一化12x_train = tf.cast(x_train,tf.float32)/255x_test = tf.cast(x_test,tf.float32)/255 噪声的添加123factor = 0.5 #增加噪声多少x_train_noise = x_train + factor*np.random.n...

2023-07-14
变分自编码器
import tensorflow as tf import numpy as np import matplotlib.pyplot as plt %matplotlib inline 加载手写数据集1(train_image,_),_ = tf.keras.datasets.mnist.load_data() 模型架构1.编码器 -> u,var 2.u,var -> 隐含变量 3.隐含变量 -> 重构图像 数据归一化1train_image = train_image/255 数据shape12train_image.shape(60000, 28, 28) 数据扁平化1train_image = train_image.reshape(-1,28*28)#扁平化 数据shape12train_image.shape(60000, 784) 转换数据类型1train_image = train_image.astype(np.float32)#转换类型 创建dataset1dataset = tf.data.Dataset.from_ten...

2023-07-14
基本自编码器
import tensorflow as tf import matplotlib.pyplot as plt 查看Tensorflow版本1tf.__version__ 加载数据集1(x_train,_),(x_test,_) = tf.keras.datasets.mnist.load_data() 扁平化12x_train = x_train.reshape(x_train.shape[0],-1)#-1 表示自动计算x_test = x_test.reshape(x_test.shape[0],-1) 123x_train.shape,x_test.shape((60000, 28, 28), (10000, 28, 28))((60000, 784), (10000, 784)) 归一化12x_train = tf.cast(x_train,tf.float32)/255x_test = tf.cast(x_test,tf.float32)/255 设置输入、输出、压缩大小123input_size = 784hidden_size = 32output_si...
2023-07-14
ResNet残差模块
import tensorflow as tf 定义ResNetBlock1234567891011121314151617181920212223class ResNetBlock(tf.keras.layers.Layer): def __init__(self,units): super(ResNetBlock,self).__init__() self.conv1 = tf.keras.layers.Conv2D(units, kernel_size=3, padding='same', use_bias=False) self.bn1 = tf.keras.layers.BatchNormalization()#批标准化 s...
2023-07-14
keras.layers 各网络层介绍
一、网络层keras的层主要包括: 常用层(Core)、卷积层(Convolutional)、池化层(Pooling)、局部连接层、递归层(Recurrent)、嵌入层( Embedding)、高级激活层、规范层、噪声层、包装层,当然也可以编写自己的层。 对于层的操作 12345678910111213141516layer.get_weights() #返回该层的权重(numpy array)layer.set_weights(weights)#将权重加载到该层config = layer.get_config()#保存该层的配置layer = layer_from_config(config)#加载一个配置到该层#如果层仅有一个计算节点(即该层不是共享层),则可以通过下列方法获得输入张量、输出张量、输入数据的形状和输出数据的形状:layer.inputlayer.outputlayer.input_shapelayer.output_shape#如果该层有多个计算节点。可以使用下面的方法layer.get_input_at(node_index)layer.get_outpu...

2023-07-14
多输出模型实例
import tensorflow as tf from tensorflow import keras import matplotlib.pyplot as plt %matplotlib inline import numpy as np import pathlib 打印Tensorflow版本1print('Tensorflow version:{}'.format(tf.__version__)) 打印是否支持GPU加速1print(tf.test.is_gpu_available()) 图片文件根目录1data_dir = './dataset/moc' 1data_root = pathlib.Path(data_dir) 12data_rootWindowsPath('dataset/moc') 获取所有图片路径1all_image_paths = list(data_root.glob('*/*')) 12345678910all_image_pa...